INTRODUCTION
In this blog, we will analyze the 'Telecustomers' data and use KNN to categorize them into four different categories, namely 1, 2, 3, and 4.
Importing Necessary Packages:
import pandas as pd
import seaborn as sns
import matplotlib.pyplot as plt
import numpy as np
Reading the data:
df=pd.read_csv('Telecustomers.csv')
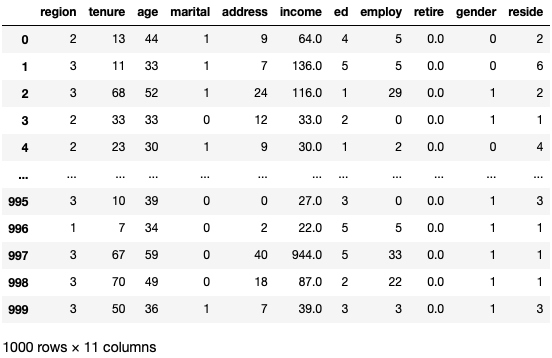
df.head()

Data Inspection:
df.columns

df.shape
(1000, 12)
df['custcat'].value_counts()

The categories of the customers seem to be quite balanced.
Data Preparation:
X=df.drop(columns=['custcat'])
X

y=df['custcat']
y

Data Preprocessing:
from sklearn import preprocessing
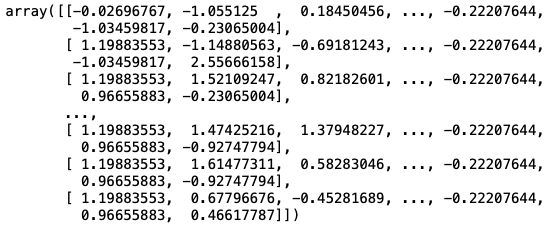
X = preprocessing.StandardScaler().fit(X).transform(X.astype(float))
X

Data Splitting:
from sklearn.model_selection import train_test_split
X_train, X_test, y_train, y_test = train_test_split( X, y, test_size=0.2, random_state=4)
X_train.shape
(800, 11)
X_test.shape
(200, 11)
KNN Model Building & Training:
from sklearn.neighbors import KNeighborsClassifier
from sklearn import metrics
K=4
neigh=KNeighborsClassifier(n_neighbors=k).fit(X_train,y_train)
Model's Prediction:
y_pred=neigh.predict(X_test)
print('Acuuracy is:',metrics.accuracy_score(y_test,y_pred))
Acuuracy is: 0.32
print(y_pred)

Error Rate for different K's:
error_rate=[]
for i in range(1,10):
    knn=KNeighborsClassifier(n_neighbors=i).fit(X_train,y_train)
    y_pred=knn.predict(X_test)
    error_rate.append(np.mean(y_test!=y_pred))
print(error_rate)
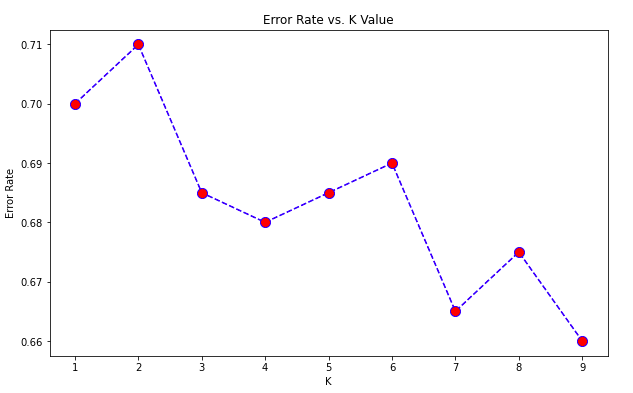
[0.7, 0.71, 0.685, 0.68, 0.685, 0.69, 0.665, 0.675, 0.66]
Visualising Error Rate VS K:
plt.figure(figsize=(10,6))
plt.plot(range(1,10),error_rate,color='blue', linestyle='dashed', marker='o',markerfacecolor='red', markersize=10)
plt.title('Error Rate vs. K Value')
plt.xlabel('K')
plt.ylabel('Error Rate')

print("Minimum error:-",min(error_rate),"at K =",(error_rate.index(min(error_rate))+1))
Minimum error:- 0.66 at K = 9
Since the error is minimum at K=9, hence the accuracy will be maximum at K=9.
Accuracy for different K's:
acc = []
from sklearn import metrics
for i in range(1,10):
    neigh = KNeighborsClassifier(n_neighbors = i).fit(X_train,y_train)
    yhat = neigh.predict(X_test)
    acc.append(metrics.accuracy_score(y_test, yhat))
Visualising Accuracy VS K:
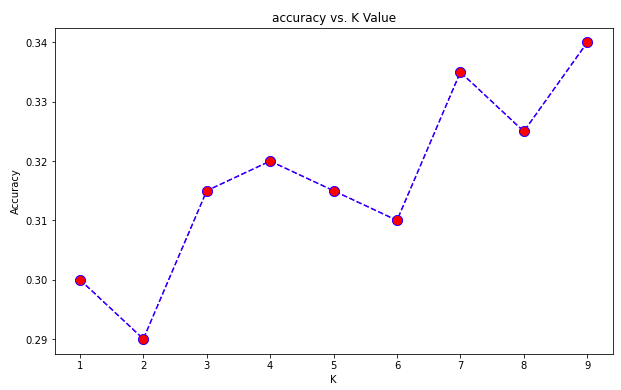
plt.figure(figsize=(10,6))
plt.plot(range(1,10),acc,color = 'blue',linestyle='dashed', marker='o',markerfacecolor='red', markersize=10)
plt.title('accuracy vs. K Value')
plt.xlabel('K')
plt.ylabel('Accuracy')

print("Maximum accuracy:-",max(acc),"at K =",acc.index(max(acc))+1)
Maximum accuracy:- 0.34 at K = 9
Conclusion:
K is set to 9 for categorizing any new telecustomers. The KNN algorithm will look at the nearest 9 neighbors, and based on the majority vote, it will assign a category to the new data/telecustomers.
