INTRODUCTION
In this blog,we will analyse 'Heart' data to predict heart attack risk using logistic regression.
Importing Necessary Packages:
import pandas as pd
import numpy as np
import seaborn as sns
import matplotlib.pyplot as plt
from collections import Counter
import pandas_profiling as pp
from sklearn.model_selection import train_test_split
from sklearn.preprocessing import StandardScaler
Reading the data:
data=pd.read_csv('heart (2).csv')
data.head()
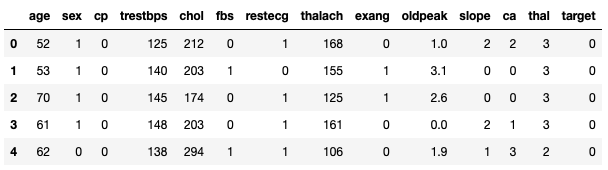
Let us understand the Heart dataset. The dataset has 14 columns with the following information:
- Age: Age of the individual.
- Sex: Gender (1 = male, 0 = female).
- Chest-pain type: Type of chest pain (1 = typical angina, 2 = atypical, 3 = non-anginal, 4 = asymptotic).
- Resting BP: Resting blood pressure in mmHg.
- Serum Cholesterol: Serum cholesterol in mg/dl.
- Fasting Blood Sugar: Fasting blood sugar > 120mg/dl coded as 1, else 0.
- Resting ECG: Electrocardiographic results (0 = normal, 1 = ST-T wave abnormality, 2 = left ventricular hypertrophy).
- Max Heart Rate: Maximum heart rate achieved.
- Exercise Induced Angina: 1 = yes, 0 = no.
- ST Depression: Depression induced by exercise relative to rest.
- Peak Exercise ST Segment: 1 = upsloping, 2 = flat, 3 = downsloping.
- Vessels Colored: Number of major vessels (0–3) colored by fluoroscopy.
- Thal: Thalassemia (3 = normal, 6 = fixed defect, 7 = reversible defect).
- Diagnosis: Presence (1, 2, 3, 4) or absence (0) of heart disease.
DATA INSPECTION:-
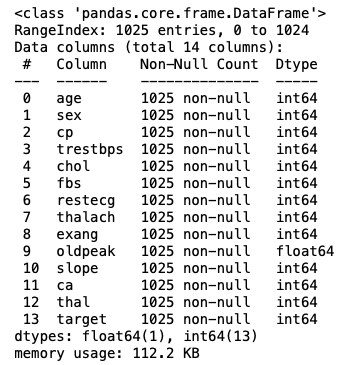
data.shape
(1025,14)
data.info()
Exploratory Data Analysis:
EDA for data is done in simple methods by one of the pandas_profiling library.
!pip install pandas_profiling
data1=pp.ProfileReport(data)
print(data1)
Pandas ProfileReport pdf link below
On generating the pandas profiling for exploratory data analysis it is clear that there are duplicate rows present in the dataset.so we are removing the duplicates.
data2=data.drop_duplicates()
data2_pp=pp.ProfileReport(data2)
print(data2_pp)
Pandas ProfileReport pdf link below
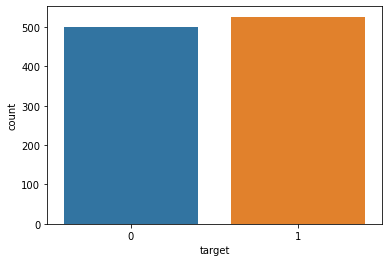
#Verifying dataset balance:-
sns.countplot(x='target',data=data)
#visualizing the distribution of hearattack possibility.
plt.show()
The dataset is fairly balanced.
MODEL BUILDING:
#Splitting the data into X(Features) and Y(Target):-0(No Heart Attack) and 1(Heart Attack).
X=data2.drop('target',axis=1)
Y=data2['target']
#Splitting the data into train and test in the ratio(80:20) for evaluating the model on test data.
X_train, X_test, y_train, y_test = train_test_split(X, Y, test_size=0.20, random_state = 0)
#Scaling of the data.
scaler = StandardScaler()
X_train = scaler.fit_transform(X_train)
X_test = scaler.transform(X_test)
#Checking the shape of train and test data.
print(X_train.shape)
print(X_test.shape)
print(y_train.shape)
print(y_test.shape)
(241, 13)
(61, 13)
(241,)
(61,)
Creating the logistic regression model:
from sklearn.linear_model import LogisticRegression
#Creating an instance/object of logistic regression class.
lr=LogisticRegression()
#Training the logistic regression model.
lr.fit(X_train,y_train)
Importing the evaluation metrics:
from sklearn.metrics import confusion_matrix,accuracy_score,roc_curve,classification_report
print(confusion_matrix(y_test,y_pred))
print(accuracy_score(y_test,y_pred))
print(classification_report(y_test,y_pred))
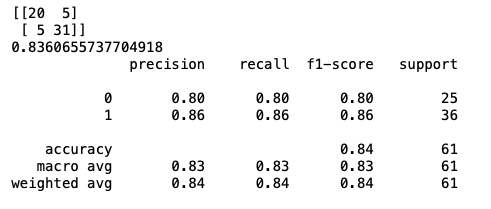
The accuracy of the model is appx.83% which is a good model. In logistic regression model,we said that we get output in terms of probability:-(predict_proba)
#Estimating target variable probability and determining its class at a 0.5 cutoff."
pred_proba=lr.predict_proba(X_test)
print(pred_proba)
#The initial column denotes the probability of Target as either 0 (no heart attack) or 1 (heart attack). The class assignment depends on which probability exceeds 0.5."
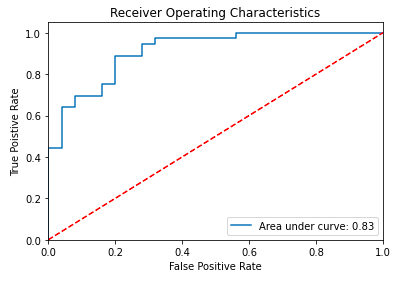
ROC_AUC(Receiver Operating Characteristics and Area Under Curve):
from sklearn.metrics import roc_auc_score
from sklearn.metrics import roc_curve
logit_roc_auc=roc_auc_score(y_test,y_pred)   #It's the area under the ROC Curve
print(logit_roc_auc)
0.8305555555555556
#For a good model,a minimum score of 0.8 is required. A higher score signifies the model's better ability to distinguish between positive and negative classes."
Plotting the ROC_AUC_CURVE:
fpr,tpr,thresholds=roc_curve(y_test,lr.predict_proba(X_test)[:,1])
plt.plot(fpr,tpr,label='Area under curve: %0.2f' %logit_roc_auc)
plt.plot([0,1],[0,1],'r--')
plt.xlim([0.0,1.0])
plt.ylim([0.0,1.05])
plt.xlabel('False Positive Rate')
plt.ylabel('True Poistive Rate')
plt.title('Receiver Operating Characteristics')
plt.legend()
plt.show()